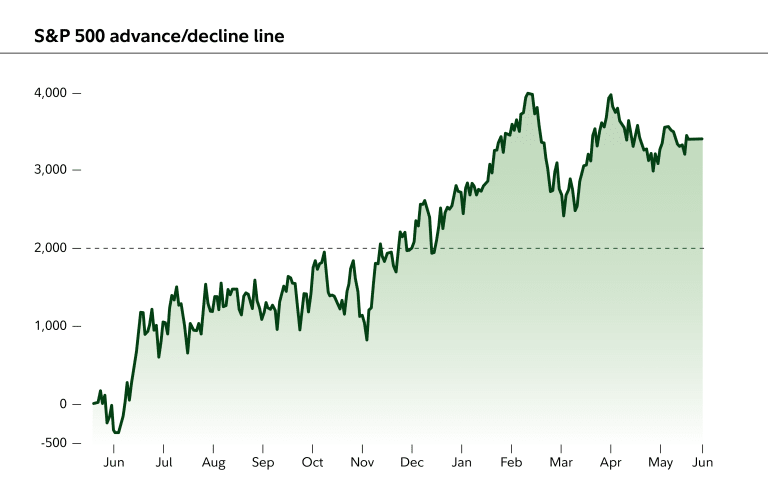
Chart of the week: Stock market breadth tracker This chart pattern may be worth watching. | June 11, 2026
> Fidelity: The advance/decline line takes the cumulative total of the number of stocks advancing less the number of stocks declining over some period of time. If stocks or an index are rising but the A/D line is falling, fewer stocks are contributing to the rally. That could signal a potential reversal of the uptrend. While stocks pushed to new record highs earlier this month, the S&P 500's advance/decline line…
Chart